JesseM1024(讨论 | 贡献) 无编辑摘要 |
JesseM1024(讨论 | 贡献) (→实测) |
||
| 第6行: | 第6行: | ||
== 实测 == | == 实测 == | ||
实际测试中,左键攻击周期5gt,魔力消耗功率40mana/s,DPS 60,有效射程16m | |||
右键技能实测与描述有较大出入,结论为 | |||
射弹预期每2gt生成一次,客户端在网络状况一般的情况下可能会看到N(2gt,1gt)的生成间隔 | |||
射弹持续生成4s,会生成41个,总计伤害4100,总周期21s,占空比19.0% | |||
射弹CEP为2.39m——有50%的射弹会掉进以触发点为圆心半径2.39m的圆内,约2000点伤害 | |||
一个0.8x0.8m的区域,4s的预期伤害仅有71.3 | |||
使用python的数据分析流程如下,以供勘误: | |||
<big>通过录制一次完整的施法视频,放入视频编辑软件中逐帧读取,获取了原始数据:</big> | |||
[[文件:A2~ABF9VHS~3@PKSLJT$YQ2.png|居中|缩略图|810x810像素|vegas pro中的标记点,为粒子出现的第一帧]] | |||
<big>将测得数据输入jupyter notebook</big> | |||
<code>import numpy as np</code> | |||
<code>import matplotlib.pyplot as plt</code> | |||
<code>#raw data</code> | |||
<code>proj = np.array([[-0.5,-0.5],[-2.5,1.5],[-0.25,1.5],[1.9,-2],[-1,2],[2.2,2.1],[2.5,3.2],[0,-2],</code> | |||
<code>[0,-1.5],[-1,-2],[-2.2,-0.5],[1,2],[1,2],[0.2,3],[-1.1,-1],[-1,0.5],</code> | |||
<code>[-3,-0.1],[-1.5,0.5],[3,2.5],[0.25,-2.5],[-1,0.4],[ -1.5, -0.6],[2.4,0.6],[2.5,0],</code> | |||
<code>[-0.5,-2.5],[1,0.5],[0.6,-1.2],[0.2,0],[2,-2.5],[3,-2.5],[-0.7,-0.5],[-0.3,1.5],</code> | |||
<code>[-1,2.5],[2.5,-2.5],[-1.8,-2.4],[1.9,-0.9],[2.1,-0.6],[0.4,-1],[2.7,-2.2],[1.5,-1.4],[2.7,0.2]])</code> | |||
<code>dt_in_frame = np.array([1,1,3,8,5,0,0,4,2,2,3,5,1,3,3,3,3,3,4,2,3,3,3,3,3,3,3,3,4,2,4,3,2,5,1,3,3,3,4,2,3])</code> | |||
<code>print(proj.shape,dt_in_frame.size)</code> | |||
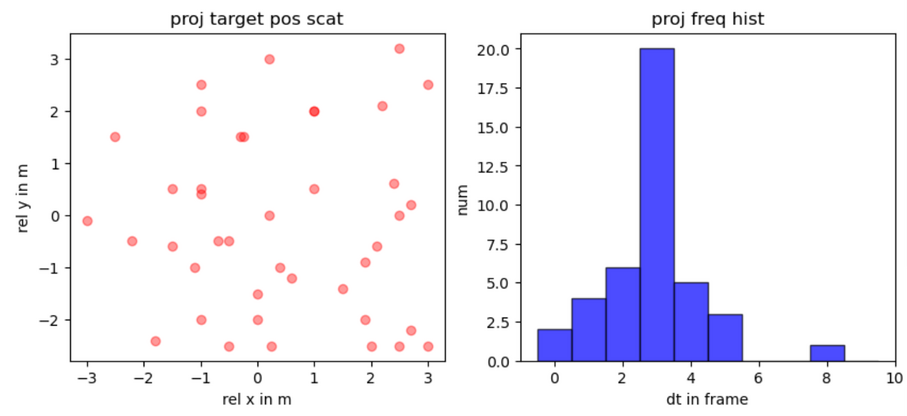
<big>终端给出:(41, 2) 41,正确无误,接下来进行数据可视化,分别绘制弹着点散点图和射弹生成间隔直方图</big> | |||
<code>t_array = 1/30.0*np.cumsum(dt_in_frame)</code> | |||
<code>plt.figure(figsize=(10, 4))</code> | |||
<code>plt.subplot(1, 2, 1)</code> | |||
<code>plt.scatter(proj[:,0],proj[:,1],c="red",alpha=0.4)</code> | |||
<code>plt.xlabel('rel x in m')</code> | |||
<code>plt.ylabel('rel y in m')</code> | |||
<code>plt.title('proj target pos scat')</code> | |||
<code>plt.subplot(1, 2, 2)</code> | |||
<code>plt.hist(dt_in_frame, bins=10, range=(0,10),alpha=0.7, color='blue', edgecolor='black', align='left')</code> | |||
<code>plt.xlabel('dt in frame')</code> | |||
<code>plt.ylabel('num')</code> | |||
<code>plt.title('proj freq hist')</code> | |||
<code>plt.show()</code> | |||
[[文件:)(1B6)`NYCF@D1MY%SIV)@Q.png|居中|缩略图|907x907像素|输出图像]] | |||
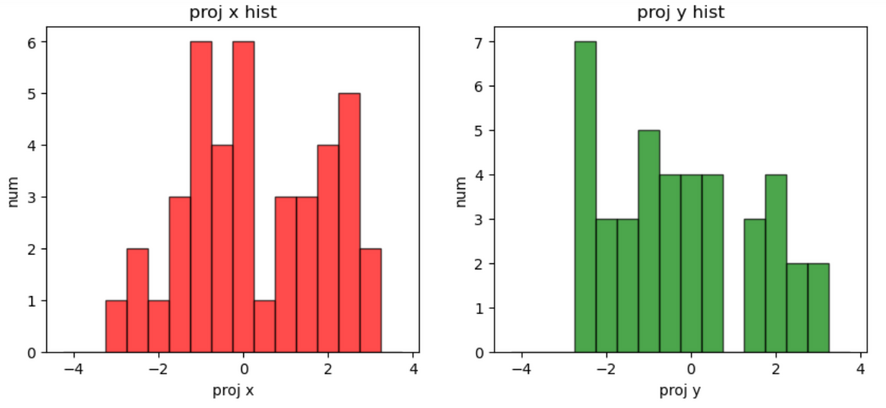
<big>分离各个射弹落点的x坐标和y坐标,分别绘制直方图,查看概率分布的关系,发现并非十分正态</big> | |||
<code>projx = proj[:,0]</code> | |||
<code>projy = proj[:,1]</code> | |||
<code>plt.figure(figsize=(10, 4))</code> | |||
<code>plt.subplot(1, 2, 1)</code> | |||
<code>plt.hist(projx, bins=16, range=(-4,4),alpha=0.7, color='red', edgecolor='black', align='left')</code> | |||
<code>plt.xlabel('proj x')</code> | |||
<code>plt.ylabel('num')</code> | |||
<code>plt.title('proj x hist')</code> | |||
<code>plt.subplot(1, 2, 2)</code> | |||
<code>plt.hist(projy, bins=16, range=(-4,4),alpha=0.7, color='green', edgecolor='black', align='left')</code> | |||
<code>plt.xlabel('proj y')</code> | |||
<code>plt.ylabel('num')</code> | |||
<code>plt.title('proj y hist')</code> | |||
<code>plt.show()</code> | |||
[[文件:LWC))5NK130TVG0BIUISJ4N.png|居中|缩略图|886x886像素|x,y直方图]] | |||
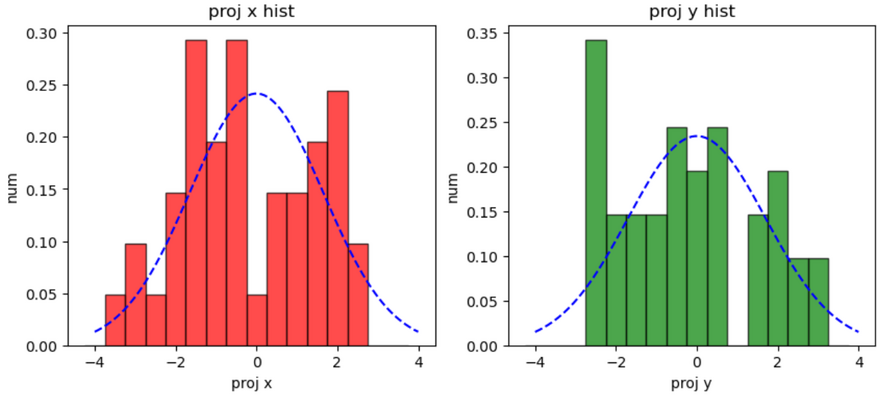
<big>尝试强行拟合为正态分布概率计算射弹落点的圆公算偏差,事实证明<code>norm.fit</code>方法没有考虑到样本的自由度减少,所以通过统计学方法计算样本方差的CEP会大一些</big> | |||
<code>#norm fit and CEP</code> | |||
<code>from scipy.stats import norm</code> | |||
<code>from scipy.optimize import curve_fit</code> | |||
<code>def N(x,mean,sig):</code> | |||
<code> return norm.pdf(x,mean,sig)</code> | |||
<code>projx_cen = projx-np.mean(projx)</code> | |||
<code>projy_cen = projy-np.mean(projy)</code> | |||
<code>meanx, sigmax = norm.fit(projx_cen)</code> | |||
<code>meany, sigmay = norm.fit(projy_cen)</code> | |||
<code>#print(meanx,meany)</code> | |||
<code>plt.figure(figsize=(10, 4))</code> | |||
<code>plt.subplot(1, 2, 1)</code> | |||
<code>plt.hist(projx_cen, bins=16, range=(-4,4),alpha=0.7, color='red', edgecolor='black', align='left',density = True)</code> | |||
<code>x_lin = np.linspace(-4, 4, 100)</code> | |||
<code>norm_curve_x = N(x_lin, meanx, sigmax)</code> | |||
<code>plt.plot(x_lin, norm_curve_x, 'b--', label='fitted norm')</code> | |||
<code>plt.xlabel('proj x')</code> | |||
<code>plt.ylabel('num')</code> | |||
<code>plt.title('proj x hist')</code> | |||
<code>plt.subplot(1, 2, 2)</code> | |||
<code>plt.hist(projy_cen, bins=16, range=(-4,4),alpha=0.7, color='green', edgecolor='black', align='left',density = True)</code> | |||
<code>y_lin = np.linspace(-4, 4, 100)</code> | |||
<code>norm_curve_y = N(y_lin, meany, sigmay)</code> | |||
<code>plt.plot(y_lin, norm_curve_y, 'b--', label='fitted norm')</code> | |||
<code>plt.xlabel('proj y')</code> | |||
<code>plt.ylabel('num')</code> | |||
<code>plt.title('proj y hist')</code> | |||
<code>plt.show()</code> | |||
<code>CEP_norm_fit = (sigmax**2+sigmay**2)**0.5</code> | |||
<code>print("CEP from norm fit is",CEP_norm_fit)</code> | |||
<code># 1/n-1sum((x-xmean)^2)</code> | |||
<code>sx = np.std(projx, ddof=1)</code> | |||
<code>sy = np.std(projy, ddof=1)</code> | |||
<code>CEP_from_raw = np.sqrt(sx**2 + sy**2)</code> | |||
<code>print("CEP from norm raw is",CEP_from_raw)</code> | |||
终端输出: | |||
CEP from norm fit is 2.3728843233284 | |||
CEP from norm raw is 2.4023622774667275 | |||
[[文件:QW6H5083(%VLDPBQERR7H$R.png|居中|缩略图|890x890像素|norm.fit的预测值与直方图]] | |||
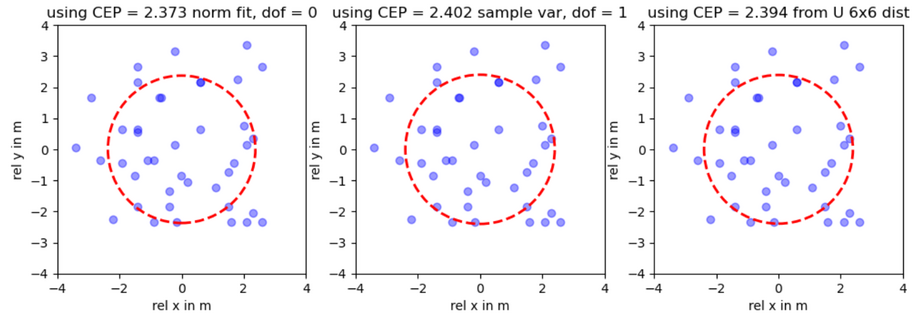
<big>这个落点甚至有可能是均匀分布的,所以额外计算了均匀分布的CEP,同时绘制了三幅图像:正态拟合CEP与实际落点,统计学方差CEP与实际落点、均匀分布CEP与实际落点</big> | |||
<code>#uniform reg</code> | |||
<code>rangex = projx_cen.max()-projx_cen.min()</code> | |||
<code>rangey = projy_cen.max()-projy_cen.min()</code> | |||
<code>print(rangex,rangey)</code> | |||
<code>#6x6 square uniform prob CEP:</code> | |||
<code>CEP_uniform = (18/np.pi)**0.5</code> | |||
<code>print("CEP form uniform is",CEP_uniform)</code> | |||
<code>fig, axs = plt.subplots(1, 3, figsize=(12, 4))</code> | |||
<code>plt.subplot(1, 3, 1)</code> | |||
<code>plt.xlim(-4, 4)</code> | |||
<code>plt.ylim(-4, 4)</code> | |||
<code>axs[0].set_aspect('equal')</code> | |||
<code>plt.scatter(projx_cen,projy_cen,c="blue",alpha=0.4)</code> | |||
<code>circle = plt.Circle((0, 0), CEP_norm_fit, edgecolor='red', facecolor='none', linestyle='--', linewidth=2, label='CEP')</code> | |||
<code>plt.gca().add_patch(circle)</code> | |||
<code>plt.xlabel('rel x in m')</code> | |||
<code>plt.ylabel('rel y in m')</code> | |||
<code>plt.title(f'using CEP = {np.round(CEP_norm_fit,3)} norm fit, dof = 0')</code> | |||
<code>plt.subplot(1, 3, 2)</code> | |||
<code>plt.xlim(-4, 4)</code> | |||
<code>plt.ylim(-4, 4)</code> | |||
<code>axs[1].set_aspect('equal')</code> | |||
<code>plt.scatter(projx_cen,projy_cen,c="blue",alpha=0.4)</code> | |||
<code>circle = plt.Circle((0, 0), CEP_from_raw, edgecolor='red', facecolor='none', linestyle='--', linewidth=2, label='CEP')</code> | |||
<code>plt.gca().add_patch(circle)</code> | |||
<code>plt.xlabel('rel x in m')</code> | |||
<code>plt.ylabel('rel y in m')</code> | |||
<code>plt.title(f'using CEP = {np.round(CEP_from_raw,3)} sample var, dof = 1')</code> | |||
<code>plt.subplot(1, 3, 3)</code> | |||
<code>plt.xlim(-4, 4)</code> | |||
<code>plt.ylim(-4, 4)</code> | |||
<code>axs[2].set_aspect('equal')</code> | |||
<code>plt.scatter(projx_cen,projy_cen,c="blue",alpha=0.4)</code> | |||
<code>circle = plt.Circle((0, 0), CEP_uniform, edgecolor='red', facecolor='none', linestyle='--', linewidth=2, label='CEP')</code> | |||
<code>plt.gca().add_patch(circle)</code> | |||
<code>plt.xlabel('rel x in m')</code> | |||
<code>plt.ylabel('rel y in m')</code> | |||
<code>plt.title(f'using CEP = {np.round(CEP_uniform,3)} from U 6x6 dist')</code> | |||
<code>plt.show()</code> | |||
[[文件:)BL)Z4G2MD~4 0WZUQ44O4O.png|居中|缩略图|922x922像素|CEP与实际落点]] | |||
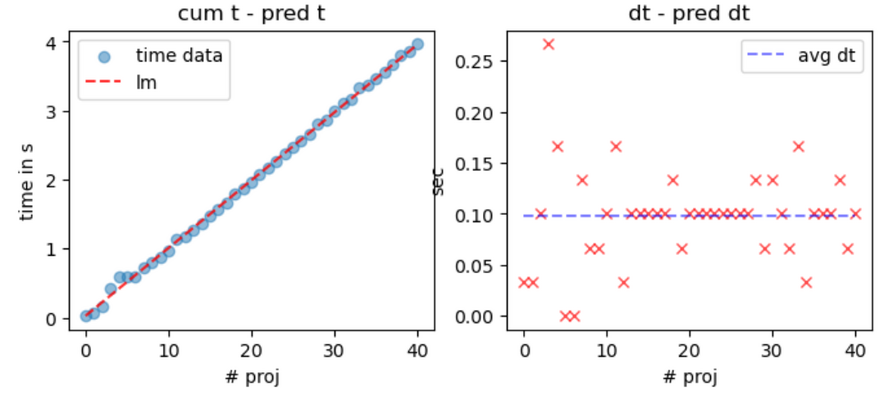
<big>对dt进行线性回归,受限于网络,射弹在客户端看来并非平均生成,好在也没有non-constant variance现象发生</big> | |||
<code>from sklearn.linear_model import LinearRegression</code> | |||
<code>lm = LinearRegression()</code> | |||
<code>x = np.arange(0, t_array.size).reshape(-1, 1)</code> | |||
<code>lm.fit(x, t_array.reshape(-1, 1))</code> | |||
<code>t_pred = lm.predict(x)</code> | |||
<code>fig, axs = plt.subplots(1, 2, figsize=(8, 3))</code> | |||
<code>plt.subplot(1, 2, 1)</code> | |||
<code>plt.scatter(x, t_array, label='time data',alpha=0.5)</code> | |||
<code>plt.plot(x, t_pred, 'r--', label='lm',alpha = 0.8)</code> | |||
<code>plt.xlabel('# proj')</code> | |||
<code>plt.ylabel('time in s')</code> | |||
<code>plt.title("cum t - pred t")</code> | |||
<code>plt.legend()</code> | |||
<code>plt.subplot(1, 2, 2)</code> | |||
<code>plt.plot(dt_in_frame/30.0,"rx",alpha = 0.7)</code> | |||
<code>x_temp = np.arange(0,41)</code> | |||
<code>y_temp = np.ones(41)*lm.coef_[0][0]</code> | |||
<code>plt.plot(x_temp,y_temp,"b--",alpha = 0.5,label = "avg dt")</code> | |||
<code>plt.legend()</code> | |||
<code>plt.xlabel('# proj')</code> | |||
<code>plt.ylabel('sec')</code> | |||
<code>plt.title("dt - pred dt")</code> | |||
<code>plt.show()</code> | |||
[[文件:(A6(4B71WIZKZ)Y(16J~%S7.png|居中|缩略图|884x884像素|射弹生成间隔分析]] | |||
<big>打印射弹生成时长的分析:</big> | |||
<code>print("Intercept:", lm.intercept_[0])</code> | |||
<code>print("coef / avg proj dealta t:", lm.coef_[0][0])</code> | |||
<code>print("std of dt is",np.std(dt_in_frame/30.0,ddof=1))</code> | |||
<code>rpm = 1/lm.coef_[0][0] * 60</code> | |||
<code>print("rpm =",rpm)</code> | |||
终端给出: | |||
Intercept: 0.026248548199767185 | |||
coef / avg proj dealta t: 0.098281068524971 | |||
std of dt is 0.04761236886961931 | |||
rpm = 610.4939730560149 | |||
2024年1月27日 (六) 14:15的版本
游戏内描述
巫师融合法杖是深蓝工坊引擎产物
巫师融合法杖的文本描述如下
实测
实际测试中,左键攻击周期5gt,魔力消耗功率40mana/s,DPS 60,有效射程16m
右键技能实测与描述有较大出入,结论为
射弹预期每2gt生成一次,客户端在网络状况一般的情况下可能会看到N(2gt,1gt)的生成间隔
射弹持续生成4s,会生成41个,总计伤害4100,总周期21s,占空比19.0%
射弹CEP为2.39m——有50%的射弹会掉进以触发点为圆心半径2.39m的圆内,约2000点伤害
一个0.8x0.8m的区域,4s的预期伤害仅有71.3
使用python的数据分析流程如下,以供勘误:
通过录制一次完整的施法视频,放入视频编辑软件中逐帧读取,获取了原始数据:
将测得数据输入jupyter notebook
import numpy as np
import matplotlib.pyplot as plt
#raw data
proj = np.array([[-0.5,-0.5],[-2.5,1.5],[-0.25,1.5],[1.9,-2],[-1,2],[2.2,2.1],[2.5,3.2],[0,-2],
[0,-1.5],[-1,-2],[-2.2,-0.5],[1,2],[1,2],[0.2,3],[-1.1,-1],[-1,0.5],
[-3,-0.1],[-1.5,0.5],[3,2.5],[0.25,-2.5],[-1,0.4],[ -1.5, -0.6],[2.4,0.6],[2.5,0],
[-0.5,-2.5],[1,0.5],[0.6,-1.2],[0.2,0],[2,-2.5],[3,-2.5],[-0.7,-0.5],[-0.3,1.5],
[-1,2.5],[2.5,-2.5],[-1.8,-2.4],[1.9,-0.9],[2.1,-0.6],[0.4,-1],[2.7,-2.2],[1.5,-1.4],[2.7,0.2]])
dt_in_frame = np.array([1,1,3,8,5,0,0,4,2,2,3,5,1,3,3,3,3,3,4,2,3,3,3,3,3,3,3,3,4,2,4,3,2,5,1,3,3,3,4,2,3])
print(proj.shape,dt_in_frame.size)
终端给出:(41, 2) 41,正确无误,接下来进行数据可视化,分别绘制弹着点散点图和射弹生成间隔直方图
t_array = 1/30.0*np.cumsum(dt_in_frame)
plt.figure(figsize=(10, 4))
plt.subplot(1, 2, 1)
plt.scatter(proj[:,0],proj[:,1],c="red",alpha=0.4)
plt.xlabel('rel x in m')
plt.ylabel('rel y in m')
plt.title('proj target pos scat')
plt.subplot(1, 2, 2)
plt.hist(dt_in_frame, bins=10, range=(0,10),alpha=0.7, color='blue', edgecolor='black', align='left')
plt.xlabel('dt in frame')
plt.ylabel('num')
plt.title('proj freq hist')
plt.show()
分离各个射弹落点的x坐标和y坐标,分别绘制直方图,查看概率分布的关系,发现并非十分正态
projx = proj[:,0]
projy = proj[:,1]
plt.figure(figsize=(10, 4))
plt.subplot(1, 2, 1)
plt.hist(projx, bins=16, range=(-4,4),alpha=0.7, color='red', edgecolor='black', align='left')
plt.xlabel('proj x')
plt.ylabel('num')
plt.title('proj x hist')
plt.subplot(1, 2, 2)
plt.hist(projy, bins=16, range=(-4,4),alpha=0.7, color='green', edgecolor='black', align='left')
plt.xlabel('proj y')
plt.ylabel('num')
plt.title('proj y hist')
plt.show()
尝试强行拟合为正态分布概率计算射弹落点的圆公算偏差,事实证明norm.fit方法没有考虑到样本的自由度减少,所以通过统计学方法计算样本方差的CEP会大一些
#norm fit and CEP
from scipy.stats import norm
from scipy.optimize import curve_fit
def N(x,mean,sig):
return norm.pdf(x,mean,sig)
projx_cen = projx-np.mean(projx)
projy_cen = projy-np.mean(projy)
meanx, sigmax = norm.fit(projx_cen)
meany, sigmay = norm.fit(projy_cen)
#print(meanx,meany)
plt.figure(figsize=(10, 4))
plt.subplot(1, 2, 1)
plt.hist(projx_cen, bins=16, range=(-4,4),alpha=0.7, color='red', edgecolor='black', align='left',density = True)
x_lin = np.linspace(-4, 4, 100)
norm_curve_x = N(x_lin, meanx, sigmax)
plt.plot(x_lin, norm_curve_x, 'b--', label='fitted norm')
plt.xlabel('proj x')
plt.ylabel('num')
plt.title('proj x hist')
plt.subplot(1, 2, 2)
plt.hist(projy_cen, bins=16, range=(-4,4),alpha=0.7, color='green', edgecolor='black', align='left',density = True)
y_lin = np.linspace(-4, 4, 100)
norm_curve_y = N(y_lin, meany, sigmay)
plt.plot(y_lin, norm_curve_y, 'b--', label='fitted norm')
plt.xlabel('proj y')
plt.ylabel('num')
plt.title('proj y hist')
plt.show()
CEP_norm_fit = (sigmax**2+sigmay**2)**0.5
print("CEP from norm fit is",CEP_norm_fit)
# 1/n-1sum((x-xmean)^2)
sx = np.std(projx, ddof=1)
sy = np.std(projy, ddof=1)
CEP_from_raw = np.sqrt(sx**2 + sy**2)
print("CEP from norm raw is",CEP_from_raw)
终端输出:
CEP from norm fit is 2.3728843233284
CEP from norm raw is 2.4023622774667275
这个落点甚至有可能是均匀分布的,所以额外计算了均匀分布的CEP,同时绘制了三幅图像:正态拟合CEP与实际落点,统计学方差CEP与实际落点、均匀分布CEP与实际落点
#uniform reg
rangex = projx_cen.max()-projx_cen.min()
rangey = projy_cen.max()-projy_cen.min()
print(rangex,rangey)
#6x6 square uniform prob CEP:
CEP_uniform = (18/np.pi)**0.5
print("CEP form uniform is",CEP_uniform)
fig, axs = plt.subplots(1, 3, figsize=(12, 4))
plt.subplot(1, 3, 1)
plt.xlim(-4, 4)
plt.ylim(-4, 4)
axs[0].set_aspect('equal')
plt.scatter(projx_cen,projy_cen,c="blue",alpha=0.4)
circle = plt.Circle((0, 0), CEP_norm_fit, edgecolor='red', facecolor='none', linestyle='--', linewidth=2, label='CEP')
plt.gca().add_patch(circle)
plt.xlabel('rel x in m')
plt.ylabel('rel y in m')
plt.title(f'using CEP = {np.round(CEP_norm_fit,3)} norm fit, dof = 0')
plt.subplot(1, 3, 2)
plt.xlim(-4, 4)
plt.ylim(-4, 4)
axs[1].set_aspect('equal')
plt.scatter(projx_cen,projy_cen,c="blue",alpha=0.4)
circle = plt.Circle((0, 0), CEP_from_raw, edgecolor='red', facecolor='none', linestyle='--', linewidth=2, label='CEP')
plt.gca().add_patch(circle)
plt.xlabel('rel x in m')
plt.ylabel('rel y in m')
plt.title(f'using CEP = {np.round(CEP_from_raw,3)} sample var, dof = 1')
plt.subplot(1, 3, 3)
plt.xlim(-4, 4)
plt.ylim(-4, 4)
axs[2].set_aspect('equal')
plt.scatter(projx_cen,projy_cen,c="blue",alpha=0.4)
circle = plt.Circle((0, 0), CEP_uniform, edgecolor='red', facecolor='none', linestyle='--', linewidth=2, label='CEP')
plt.gca().add_patch(circle)
plt.xlabel('rel x in m')
plt.ylabel('rel y in m')
plt.title(f'using CEP = {np.round(CEP_uniform,3)} from U 6x6 dist')
plt.show()
对dt进行线性回归,受限于网络,射弹在客户端看来并非平均生成,好在也没有non-constant variance现象发生
from sklearn.linear_model import LinearRegression
lm = LinearRegression()
x = np.arange(0, t_array.size).reshape(-1, 1)
lm.fit(x, t_array.reshape(-1, 1))
t_pred = lm.predict(x)
fig, axs = plt.subplots(1, 2, figsize=(8, 3))
plt.subplot(1, 2, 1)
plt.scatter(x, t_array, label='time data',alpha=0.5)
plt.plot(x, t_pred, 'r--', label='lm',alpha = 0.8)
plt.xlabel('# proj')
plt.ylabel('time in s')
plt.title("cum t - pred t")
plt.legend()
plt.subplot(1, 2, 2)
plt.plot(dt_in_frame/30.0,"rx",alpha = 0.7)
x_temp = np.arange(0,41)
y_temp = np.ones(41)*lm.coef_[0][0]
plt.plot(x_temp,y_temp,"b--",alpha = 0.5,label = "avg dt")
plt.legend()
plt.xlabel('# proj')
plt.ylabel('sec')
plt.title("dt - pred dt")
plt.show()
打印射弹生成时长的分析:
print("Intercept:", lm.intercept_[0])
print("coef / avg proj dealta t:", lm.coef_[0][0])
print("std of dt is",np.std(dt_in_frame/30.0,ddof=1))
rpm = 1/lm.coef_[0][0] * 60
print("rpm =",rpm)
终端给出:
Intercept: 0.026248548199767185
coef / avg proj dealta t: 0.098281068524971
std of dt is 0.04761236886961931
rpm = 610.4939730560149

